Building a Simple, Economical Observability Stack
When designing an observability architecture, it can be tempting to adopt every cutting-edge tool available. However,we decided to take a more pragmatic approach. Our goal was clear: build a simple, economical, and AWS-internal monitoring stack using Grafana OSS, while keeping the door open for future enhancements like tracing and frontend monitoring. Here is a look at how we architected our new observability stack to balance developer experience, operational efficiency, and cost.
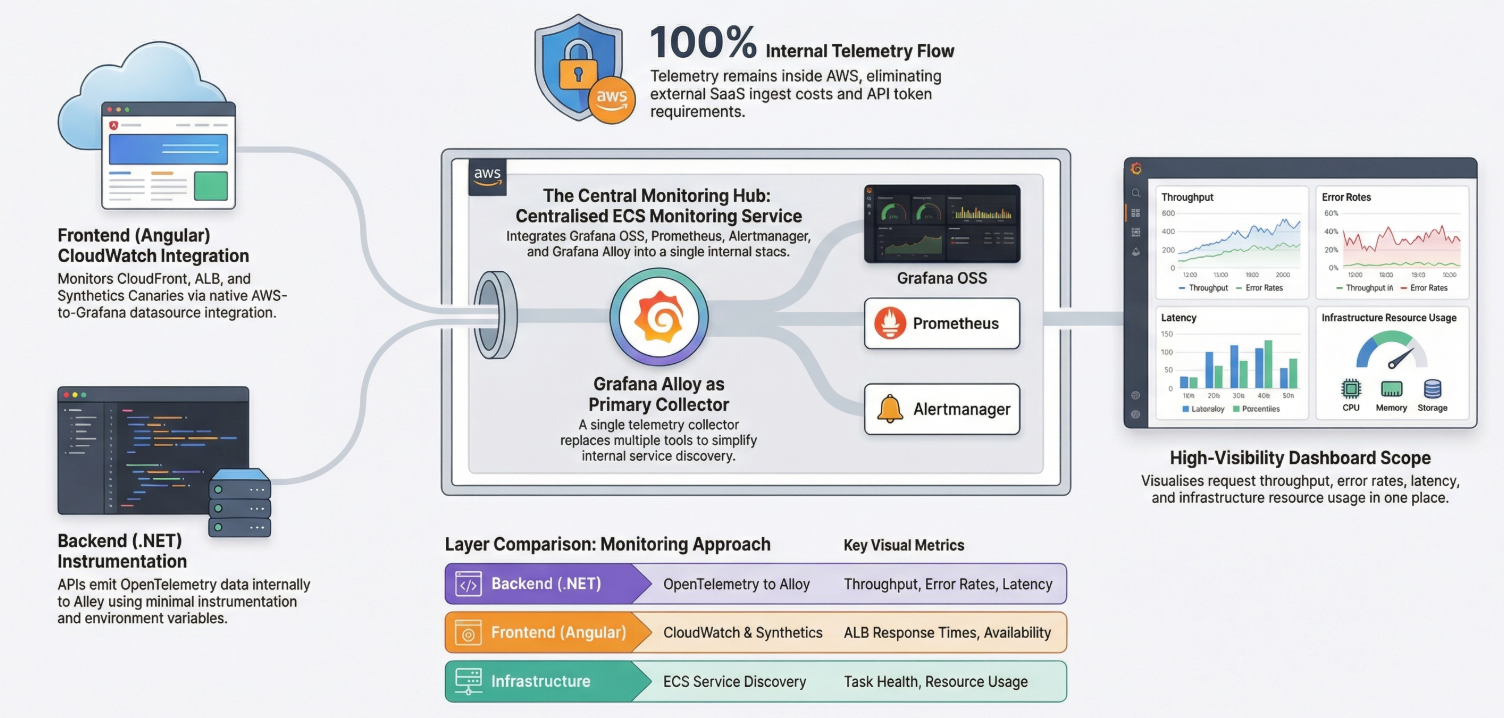
The Central Observability Hub At the heart of our architecture is a dedicated Monitoring ECS Service. This service acts as our central observability hub and runs our core toolset: • Grafana OSS for visualization. • Prometheus for backend metrics. • Alertmanager for notifications. • Grafana Alloy, which serves as our central telemetry collector.
By using Alloy, we've simplified our architecture by replacing the need for multiple different collectors.
Backend Monitoring: Keeping it Simple for .NET Developers For our .NET backend APIs, we wanted to ensure the developer experience was as frictionless as possible. Developers are only required to add minimal, vendor-neutral OpenTelemetry instrumentation to their services. These backend services emit their OpenTelemetry data directly to Grafana Alloy using internal service discovery. This approach comes with major perks for our engineering team: there are no Grafana API tokens to manage in the application code, no Grafana Cloud endpoints to configure, and no AWS ADOT setup required. Application logs simply remain in AWS CloudWatch Logs. Backend dashboards track crucial metrics like request throughput, error rates, latency, and dependency performance.
Frontend Monitoring: Leveraging AWS-Native Tools For our Angular frontend applications, we opted to skip browser-level Real User Monitoring (RUM) for this initial phase. Instead, we are leaning entirely on AWS-native monitoring.
Our frontend observability relies on: • CloudWatch Metrics to track CloudFront requests, latency, errors, ALB target response times, and API health. • CloudWatch Synthetics Canaries to perform frontend availability checks, monitor health endpoints, and run basic synthetic user journeys. Grafana seamlessly consumes these CloudWatch metrics through a standard datasource integration, giving us full visibility into CloudFront availability and synthetic canary results in one place.
Why This Architecture Wins This architecture delivers several immediate benefits to the platform: • It is Economical: Because telemetry stays entirely inside AWS, we avoid expensive external SaaS ingestion costs.
• It is Developer-Friendly: The minimal OpenTelemetry setup means developers can focus on building features rather than wrestling with complex monitoring SDKs.
• It is Future-Ready: While things like Tempo tracing, Loki log aggregation, and browser RUM instrumentation are out of scope for now, the architecture is designed so they can be easily added later without requiring a fundamental redesign.